


Veterinary Hospital
Lloyd Veterinary Medical Center
Hours: Monday through Friday, 8 am-5 pmEmergency services: 24 hours a day
Referring DVM Login


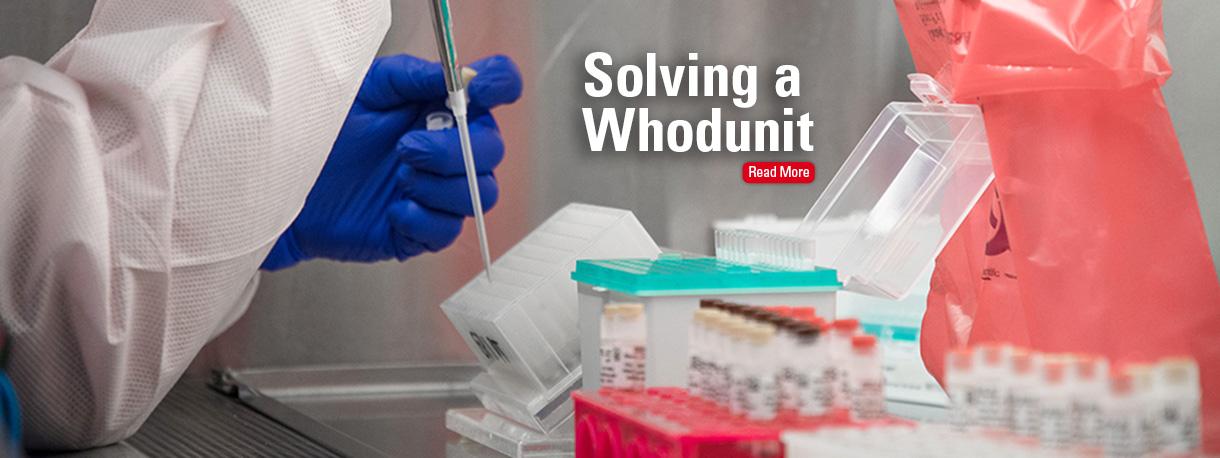
Diagnostic Services
515-294-1950 | 515-294-3564 (Fax)
isuvdl@iastate.edu
Client Login
Department of Veterinary Pathology Diagnostic Services
Clinical Pathology and Biopsy Services
515-294-3282 | 515-294-7730 (Fax)
Client Login
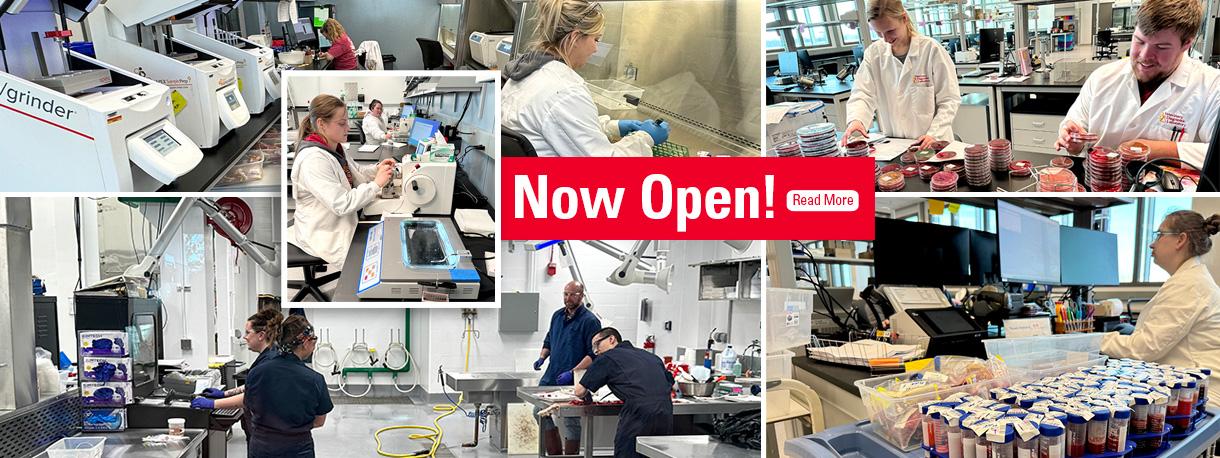
VDL Construction Updates
See live progress on the construction of the new Veterinary Diagnostic Laboratory.
Connect Socially


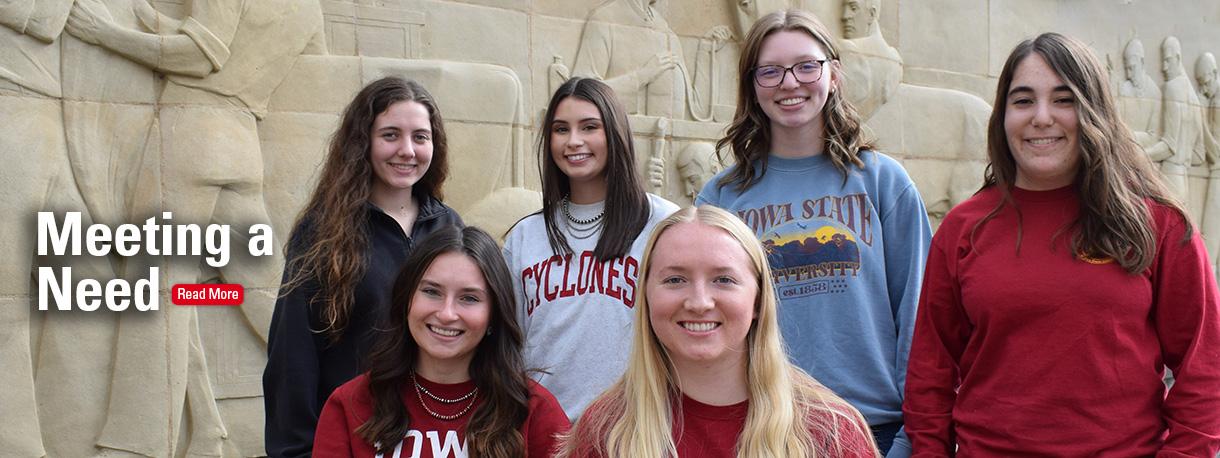
Future Students
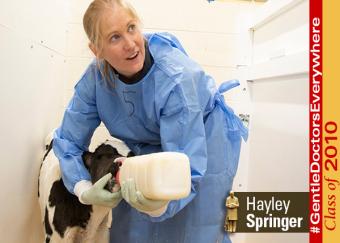
#GentleDoctorsEverywhere